Data visualization + Information Design + Interaction Design
Hello! I'm Júlia! I'm an assistant professor (tenured) in the Design Course at Universidade Federal Fluminense (UFF). I have over 10 years of practical and academic experience with design for traditional media (print and web) and new media (mobile apps, digital publishing, VR-AR and exhibition design), with a particular interest in digital media, interaction design, information design, data visualization and digital humanities.
I hold a Ph.D. in Design and Technology (2020) at Universidade do Estado do Rio de Janeiro (UERJ) and a Master's degree (MSc) in Communication Science (2014) at Universidade de São Paulo, Brazil.
Currently, I'm also a visiting professor at FGV and IDP. In 2019, I founded DatavizRio, project interested in the dissemination and teaching of data visualization practice.
Education.
2020-2023
Design Graduation Program, Federal University of Rio de Janeiro (EBA-UFRJ), Brazil
Postdoctoral Researcher in a project funded by Bill & Melinda Gates Foundation and CNPq. Find out more here (portuguese only).
2015-2020
Design Graduation Program, State University of Rio de Janeiro (ESDI-UERJ), Brazil
Ph.D in Design and Technology. The thesis investigated alternative, visual, and more generous browsing strategies for digital tools with a particular interest in digital photographic collections. Access the thesis here (portuguese only).
2012-2014
School of Communication and Arts, University of São Paulo (PPGCOM-USP), Brazil
Master's degree in Communication Science. The dissertation investigated interfaces between information visualization, infographics and interactivity in journalistic sites. Access the dissertation here (portuguese only).
2005-2010
Design Undergratuate School, Federal University of Rio de Janeiro (EBA-UFRJ), Brazil
Bachelor in Industrial Design - Visual Programming with one year academic exchange at Università degli Studi di Torino (Turin, Italy).
Selected Projects.
"Dataviz em Perspectiva" Book
(2020 - 2023)
First book of unpublished texts on data visualization published in portuguese in Brazil
Production in the field of data visualization takes place both in teaching and research and in the scope of professional practice. Thus, to record a comprehensive panel of this recent production, this publication has been organized into two sections. The first has seven chapters written by research professors who talk and reflect on their production in the classroom. These reports cross the three inseparable pillars that are the basis of academic knowledge - undergraduate, graduate and extension - and bring together a rich collection of experiences that can help in the theoretical-methodological maturation of an expanding area. The second section of the work includes an interview and six chapters written by professionals working in different contexts – from journalism to business management, including the arts – who share their experiences and design practices in the design and development of data visualization.
This multifaceted, diverse and accessible panorama has the prospect of boosting production on data visualization developed in the country, disseminating the field inside and outside the academy.
Data Science project funded by Bill & Melinda Gates Foundation and CNPq.
This project aims to develop interactive tools for the exploration and visual analysis of data applied to maternal and child health in the pre- and perinatal periods. In particular, it seeks to expand the traditional mortality model to include aspects related to emerging diseases, extreme climatic conditions and environmental problems
The best of Brazilian Information Design from 2019 to 2021.
The exhibition is an initiative of the Association of Graphic Designers of Brazil (ADG Brasil) and the Brazilian Society of Information Design (SBDI) and is guided by the need to bring together the best of Information Design projects, products, and services.
Its goal is to identify, gather, register and publish works that emphasize the applications of Information Design, carried out from January 1, 2019 until the date of submission of the proposal, by individuals (self-employed professionals and students of learning and graduate), private,
public, mixed capital companies, civil society organizations and startups.
A data-driven identity for the Visuality and Visualization Lab of UFRJ.
In 2020, LabVis completed 10 years and the lab team were motivated to create a commemorative brand that reflected the labs's retrospective. The solution is a data-driven identity
that takes on attributes from a data visualization. Through a process of research, conceptualization, visual coding and programming, a data visualizations brand were generated for each year of the Laboratory's trajectory.
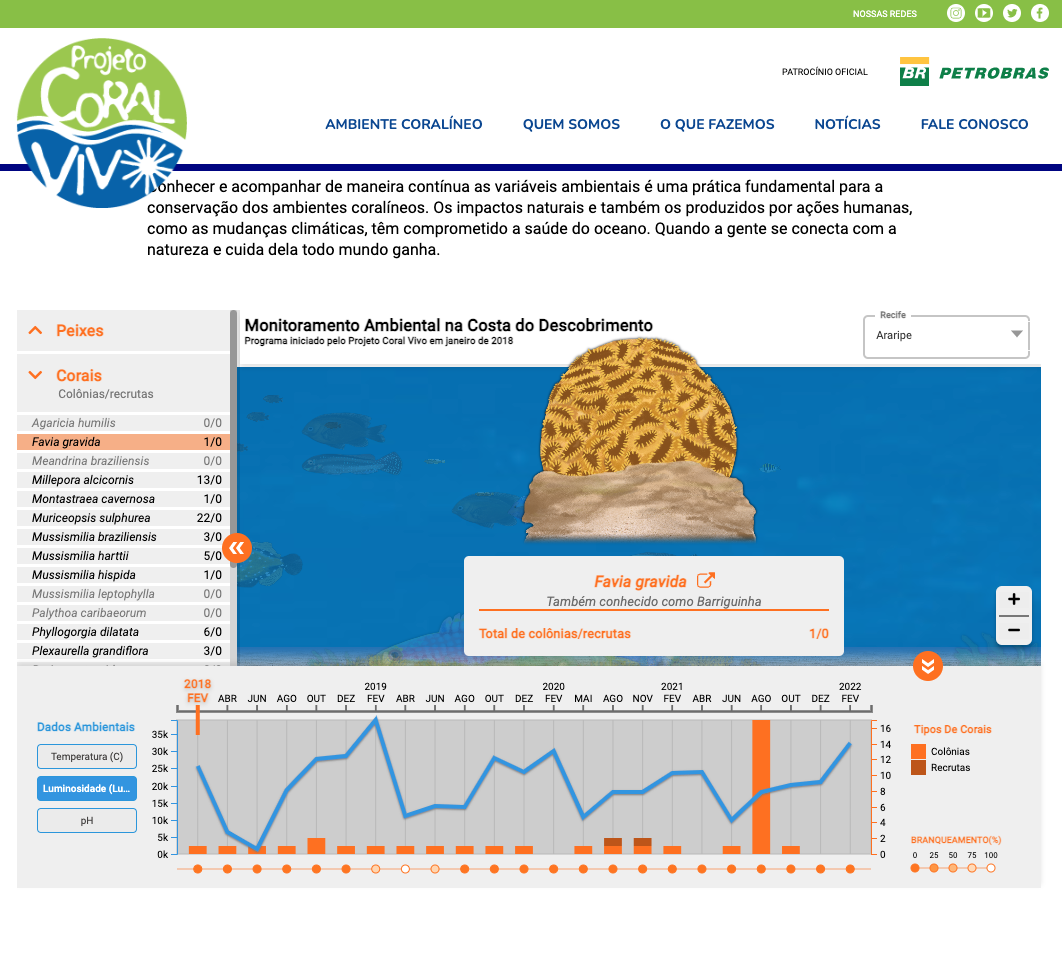
Environmental monitoring and data visualization of coralline ecosystems in Brazil
The Coral Vivo project, founded in 2003 by professors from the Museu Nacional/UFRJ, works towards the conservation and socio-environmental sustainability of Brazil's coral ecosystems.
In 2020, Coral Vivo partnered with LabVis-UFRJ to develop an interactive data visualization to represent environmental monitoring on three reefs in Brazil. It is an unconventional data visualization that allows
the user to explore the monitoring data both from illustrations of the different animals in the ecosystem and from the filter and selection resources available in the information panels.
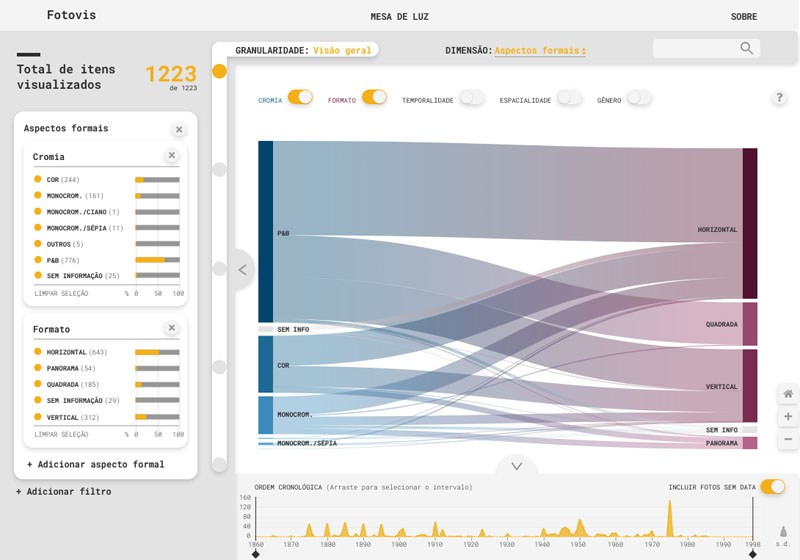
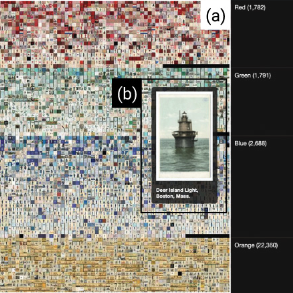
A tool for visualizing, exploring, and analyzing photographic collections.
Fotovis is a tool for visualizing, exploring, and analyzing photographic collections. It is a partial result of a PhD thesis that investigated alternative, visual, and more generous browsing strategies — based on Digital Humanities — for digital tools. This paper discusses how Fotovis was conceived, developed (at the prototype level), and evaluated (at the interface level), through a user-centered approach and using a sample of photographs from the Moreira Salles Institute, an important Brazilian cultural entity.
Curated meetups on how Brazilian practitioners and researchers see the field
DatavizRio is a project of dissemination and teaching of data visualization practice by the design lens. We promote public and free meetups about theoretical, methodological, practical, and professional aspects of dataviz.
We also offer teaching-learning activities in the area of data visualization, including workshops and short courses.
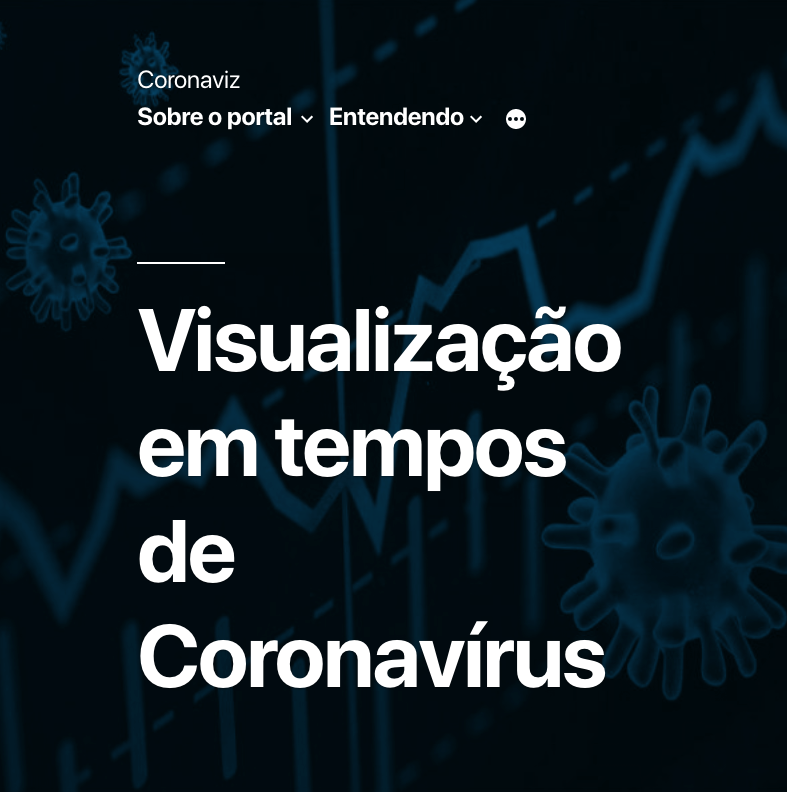
Curated content about Covid-19 from Mathematics and Information Design lens
In 2020, we have seen a lot of data visualizations about Covid-19 in the media. The website “Coronaviz: visualization in times of Coronavirus”
is an initiative by Visgraf, from the Institute of Pure and Applied Mathematics (IMPA), and disseminates curated content about Covid-19 from Mathematics and Information Design lens.
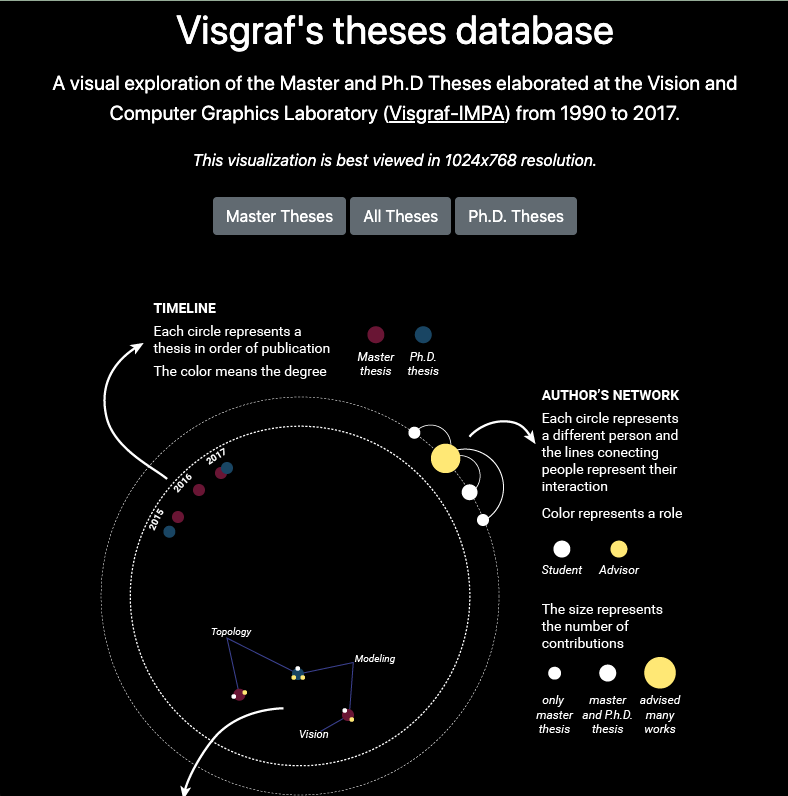
A visual exploration of the Master and Ph.D Theses elaborated at Visgraf-IMPA
Visgraf's theses database is a visual exploration of the Master and Ph.D Theses elaborated at the Vision and Computer Graphics Laboratory (Visgraf-IMPA) from 1990 to 2017.
Research and development for enhancing photographic collections
In June 2018, the Visgraf Laboratory from the Institute of Pure and Applied Mathematics (IMPA), and the Photography Department from Instituto Moreira Salles (IMS) signed a cooperation agreement focused on research and application development for the dissemination of the IMS photographic collection. This website reports the main results obtained under this agreement so far. We believe that both the lived experience and the results obtained in this process envision an unprecedented form of integration between two outstanding institutions in their respective areas of excellence: scientific and cultural, with mutual benefit in the context of today's complex technological and social transformations.
VR Tour is a technological platform for exploration of content in virtual reality
VR Tour is a technological platform for the exploration of content in virtual reality. The project takes a practice-led and collaborative approach,
whereby the main focus lies on production aspects of VR applications. The technological infrastructure used in VR Tour is based on the VR Kino+Theater platform that exploits concepts of Situated Participatory Virtual Reality and Live 3D Digital Cinema.
Deep learning and media visualization experiments with Rio 2016 images
In addition to conception and design of OBSERVATÓR!O2016 website and motivated by Luis Velho’s research concerns and initiative, the VISGRAF Lab is also interested in framing Rio-2016 data in the context of Deep
Learning. Since the data collected are stored in their entirety, novel experiments and research topics are possible.
In this sense, we inaugurated a second research line which involves Deep Learning approaches for attending computer vision tasks such as image classification.
A web-based platform for monitoring, structuring and visualizing the online response to Rio 2016 Olympic Games on Twitter
OBSERVATÓR!O2016 monitors and presents visualizations of large volumes of data about the Olympic Games
collected mainly from Twitter. The project aims to highlight the multiplicity of perspectives, controversies and themes related
to the sporting event and enhance cognition of the debate through structured and interactive visualizations. This project was
developed at VISGRAF Laboratory and is is set in a line of research that seeks to structure big social data (visual and textual)
and make it more accessible and discoverable through novel techniques for data capture, analyses and representation
Fotovis: user-centered development of a tool for visually browsing photographic collections
InfoDesign, v. 18, n. 3, 2021
Fotovis is a tool for visualizing, exploring, and analyzing photographic collections. It is a partial result of a PhD thesis that investigated alternative, visual, and more generous browsing strategies ...
Animation and data visualization: an analysis protocol proposal
InfoDesign, v. 18, n. 3, 2021
Animation can have a range of purposes when applied to data visualization. It can be used to enhance a chart’s readability, make it more appealing, or aid the narrative storytelling. The objective of this paper is ...
Paradigmas contemporâneos para difusão e consulta de artefatos da cultura visual
Revista Acervo, v. 34, 2021
Observa-se atualmente substancial debate sobre a atuação de metadados ricos e variados na estrutura-ção, visualização e recuperação de coleções. Mediante a identificação de recentes pesquisas ...
Proceeedings of the 10º CIDI (Congresso Internacional de Design da Informação), 2021
O presente artigo discute o desenvolvimento de uma marca cambiante utilizando princípios da visualização de dados sob a ótica do Design da Informação. O trabalho foi desenvolvido no âmbito do Laboratório ...
Do avesso: narrativa de dados sobre os impactos socioambientais do fast fashion
Proceeedings of the 10º CIDI (Congresso Internacional de Design da Informação), 2021
Este artigo tem como objetivo apresentar os resultados de um Trabalho de Conclusão de Curso queinvestigou como a visualização de dados aliada a recursos narrativos pode ser empregada na construçãode um artefato digital ...
Strategic Design Research Journal, v. 14, n. 1, 2021
Currently, we observe a proliferation of data visualizations about Covid-19 in the media, which makes it a convenient time to study the topic from the perspective of different disciplines, including information design and mathematics ...
VR-TOUR: Guided participatory meta-narrative for virtual exploration
Geminis, v. 10, n. 2, 2019
Neste artigo apresentamos o VR Tour, uma plataforma para exploração de realidade virtual participativa guiada baseada em um paradigma meta-narrativo. Nossa pesquisa adota uma abordagem prática e colaborativa, ...
A captura ou a elaboração de uma imagem pode ser realizada por diversas técnicas: fotografia, pintura, colagem, computação gráfica ou outra forma artística. No âmbito digital, imagens caracterizam-se por ...